File:Folio Plot BCG Matrix Example.png

Size of this preview: 594 × 599 pixels. Other resolutions: 238 × 240 pixels | 476 × 480 pixels | 595 × 600 pixels | 762 × 768 pixels | 1,015 × 1,024 pixels | 2,816 × 2,840 pixels.
Original file (2,816 × 2,840 pixels, file size: 75 KB, MIME type: image/png)
Summary
| Description |
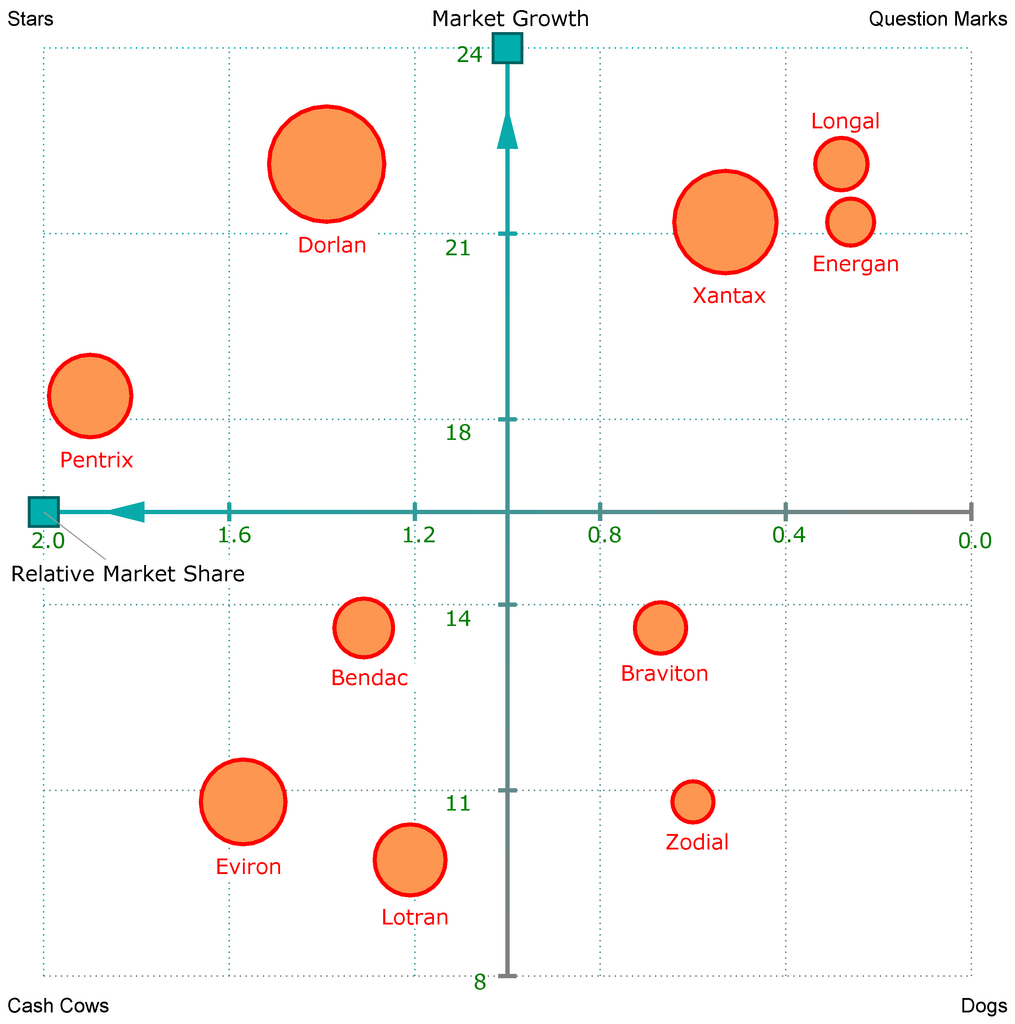
English: Folio plot of a BCG matrix analysis using an example data set. The folio plot visualizes the relative market share of a portfolio (hence the name) of products versus the growth of their market. The measurements are visualized as squares, and the objects as circles that differ in size by their sales volume. The PNG was created with Foliomap. |
| Date | |
| Source | Template:Ericmelse |
| Author | Ericmelse |
Licensing
I, the copyright holder of this work, hereby publish it under the following license:
This file is licensed under the Creative Commons Attribution 3.0 Unported license.
- You are free:
- to share – to copy, distribute and transmit the work
- to remix – to adapt the work
- Under the following conditions:
- attribution – You must give appropriate credit, provide a link to the license, and indicate if changes were made. You may do so in any reasonable manner, but not in any way that suggests the licensor endorses you or your use.
File history
Click on a date/time to view the file as it appeared at that time.
| Date/Time | Thumbnail | Dimensions | User | Comment | |
|---|---|---|---|---|---|
| current | 12:40, 22 February 2010 | | 2,816 × 2,840 (75 KB) | Ericmelse | {{Information |Description={{en|1=Folio plot of a BCG Matrix Analysis using an example data set. The folio plot visualizes the relative market share of a portfolio (hence the name) of products versus the growth of their market. The measurements are visual |
File usage
There are no pages that link to this file.